



Most landscaping companies think they know which services make money. They look at mowing margins and feel good about that 45% gross. Then hardscaping shows 28% and they wonder if it's worth the hassle. The problem is those numbers are usually wrong.
The typical landscaper's P&L treats labor as one big pool. Overhead gets spread evenly across all revenue. Travel time disappears into "indirect costs." By the time you're making decisions about which services to push or cut, you're working with numbers that don't reflect reality.
Having built profitability tracking systems for dozens of landscaping operations—from solo operators to 15-crew companies—the pattern is consistent. The ones who actually understand their service line profitability operate differently. They price better, schedule smarter, and know exactly which services fund their growth versus which ones just keep crews busy.
Why Standard P&Ls Fail Landscaping Companies
Your bookkeeper probably gives you a monthly P&L that looks fine on paper. Revenue minus costs equals profit. Simple enough. But landscaping operations break this model in three real ways.
First, labor intensity varies wildly between services. Your best mower operator knocks out 12 lawns in 8 hours. That same person spends 8 hours on one paver repair. The P&L doesn't capture this—it just shows total labor cost divided by total revenue.
Second, seasonal overhead creates distortion. You're paying shop rent and equipment leases year-round, but 70% of your revenue happens April through October. Spreading those costs evenly makes winter services look unprofitable and summer services look amazing, when really you need both to cover fixed costs.
Third, travel and disposal aren't random expenses—they're directly tied to specific service types. Mowing routes cluster efficiently. Tree work sends trucks 45 minutes to the transfer station. Installation jobs need multiple supply runs. These differences matter when you're deciding whether to take that oak removal job 35 minutes away.
The result? Companies keep unprofitable services because they "seem busy." They underprice complex work because the gross margin looks acceptable. They pass on profitable small jobs because the dollar amount seems low.
Building a Time-Allocated Labor System
Real service line profitability starts with tracking where labor hours actually go. Not just "Dave worked 40 hours this week" but "Dave spent 6.5 hours on the Johnson installation, 2 hours driving between jobs, and 1.5 hours at the supply yard for the Johnson job."
Never miss a job detail again.
Yardyly helps you plan, confirm, and manage every landscaping project seamlessly.
- Centralized project scheduling
- Automated client updates
- Crew and resource management
No credit card required
Here's the allocation framework that works in practice:
Direct Service Time: Clock starts when crew begins productive work at the property, stops when they load up to leave. This includes all work directly generating revenue for that specific job.
Attributed Travel Time: Driving to the first job of the day gets split across all jobs that day weighted by revenue. Travel between jobs gets allocated to the destination job. Return trip from last job gets allocated to that final job. Supply runs and disposal trips get tagged to specific jobs.
Indirect Labor: Shop time, equipment maintenance, and meetings get pooled and allocated based on direct service hours. If mowing used 60% of direct hours this month, it carries 60% of indirect labor.
-
7
00 AM - Left shop for Williams mowing
-
7
25 AM - Started Williams mowing
-
8
40 AM - Finished Williams, heading to Oak St (3 lawns)
-
9
05 AM - Started Oak St route
-
11
30 AM - Finished Oak St, lunch break
-
12
00 PM - Heading to Johnson installation
-
12
20 PM - Started Johnson paver repair
-
3
30 PM - Heading to Home Depot for polymeric sand
-
4
15 PM - Back at Johnson job
-
5
00 PM - Finished Johnson, heading back to shop
-
5
30 PM - Arrived at shop
From this, you can accurately allocate: Williams gets 1.25 hours direct time plus 25 minutes morning travel (split with other jobs). Oak St gets 2.5 hours direct plus 25 minutes travel from Williams. Johnson gets 3.5 hours direct, 20 minutes travel from lunch, 45 minutes supply run, and 30 minutes return travel.
Require crews to note return trips as separate entries to ensure accurate travel allocation.
Here's a simple workflow image to visualize the time allocation process.
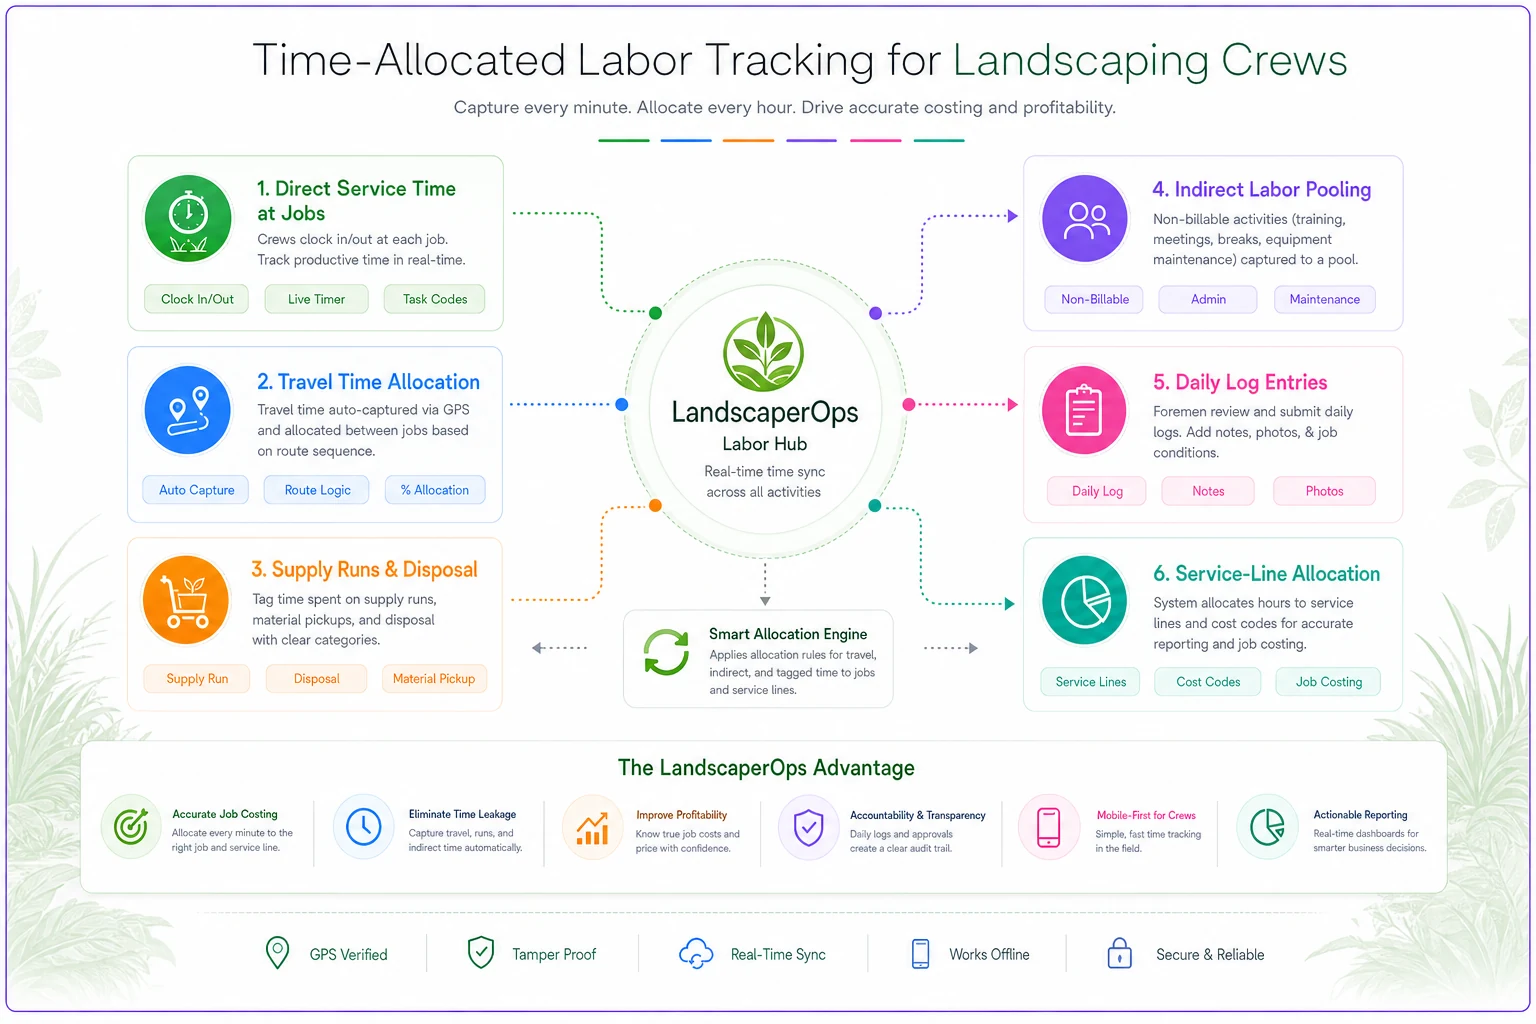
This workflow ties crew logs to per-job labor and travel allocations so you can build accurate service-line costs.
The Seasonal Overhead Distribution Problem
Fixed costs don't care about your seasonal revenue patterns. Your $3,200 monthly shop lease costs the same in January when you're doing $8,000 in snow removal as it does in June when you're billing $78,000.
Most companies handle this wrong. They either spread overhead evenly by month—making winter look terrible—or allocate by revenue percentage, making summer carry too much burden. Both distort real profitability.
The better approach: annualized overhead pools distributed by service-specific drivers.
Facility Overhead Pool: Shop rent, utilities, property insurance. Distribute based on equipment hours used by each service. If mowing uses equipment 800 hours annually, it carries that percentage of facility costs.
Equipment Overhead Pool: Lease payments, depreciation, fleet insurance. Allocate based on actual equipment usage. Track which equipment each service uses and for how many hours.
Administrative Overhead Pool: Office salaries, software, professional services. Distribute based on transaction complexity. Installation jobs with multiple change orders and progress billing carry more weight than straightforward mowing routes.
Here's what this looks like in practice:
| Overhead Type | Annual Cost | Distribution Method | Mowing Share | Installation Share | Maintenance Share |
|---|---|---|---|---|---|
| Facility | $38,400 | Equipment hours | 45% | 30% | 25% |
| Equipment | $64,000 | Direct usage logs | 40% | 45% | 15% |
| Administrative | $42,000 | Transaction weight | 25% | 55% | 20% |
This gives you real overhead burden per service line: Mowing carries roughly $51,000 annually, Installation around $67,000, Maintenance about $27,000. Divide by service hours to get hourly overhead rates that reflect actual resource consumption.
Service-Specific Disposal and Travel Rules
Some costs hide in plain sight. That $65 dump fee looks small on a $1,200 tree job. But add 90 minutes round trip to the transfer station, and suddenly you've got $155 in disposal costs eating 13% of revenue.
Disposal Costs:
-
Dump fees
Tag directly to the job
-
Travel time to disposal
Full allocation to that job
-
Mixed loads
Allocate by volume percentage
-
Daily dump runs
Split by weight or volume from each job
Travel Patterns by Service:
-
Maintenance routes
Morning travel splits evenly, between-job travel to destination, return travel to last job
-
Installation jobs
All travel (including supply runs) to that specific job
-
Emergency calls
Full travel burden including return trip
-
Estimates that don't convert
Pool and allocate across won jobs as sales overhead
Track these for a month and patterns start showing up. Tree work averages around 1.8 hours of disposal time per job. Installation projects need roughly 2 to 3 supply runs on average. Spring cleanups cluster efficiently with 12 minutes travel between stops, while aerations spread out with closer to 28 minutes between properties.
Monthly Reconciliation Process
Numbers drift without monthly reality checks. Your allocation system means nothing if nobody maintains it. Here's the reconciliation routine that keeps profit numbers honest:
Week 1 of Each Month: Pull time logs and verify completeness. Missing days? Track them down. Suspicious entries? Verify with crew leaders. Match timesheet hours to logged hours—differences over 5% need investigation.
Week 2: Run the allocation calculations. Apply your labor distribution rules. Allocate overhead pools. Assign travel and disposal costs. Generate preliminary P&L by service line.
Week 3: Sanity check the numbers. Did mowing margins drop 8%? Find out why. Installation showing 50% gross? You probably missed some costs. Compare to previous months and investigate variances over 10%.
Week 4: Adjust and finalize. Make corrections based on investigations. Update allocation rules if needed. Distribute final P&L reports with variance explanations.
The key is consistency. Same process, same timing, every month. After three months, you'll spot problems immediately. After six months, crews start self-correcting their time tracking.
Dashboard Triggers That Drive Decisions
Static reports tell you what happened. Dashboard triggers tell you when to act. Build these into your profitability tracking system:
Service Line Triggers:
-
Gross margin below 35%
Review pricing and efficiency
-
Labor percentage over 45%
Audit time tracking and productivity
-
Travel time over 20% of job time
Reconsider service area or routing
-
Overhead burden exceeding 25%
Service may not generate enough revenue to justify fixed costs
Comparative Triggers:
-
Service line 15% below company average
Deep dive required
-
Month-over-month margin drop exceeding 10%
Investigate immediately
-
Disposal costs over 8% of revenue
Review disposal practices and alternatives
Growth Decision Triggers:
-
Service maintaining 40%+ margin for 3 months
Consider expansion
-
Consistent 50%+ margins
Probably underpriced, test increases
-
Margins under 25% for 2 months
Reduce or eliminate unless strategic
These aren't just warning lights—they're action prompts. When installation margins hit 43%, you know you can afford that second installation crew. When maintenance margins slide to 31%, you stop discounting those contracts.
Real Allocation Worksheets and Rules
Theory means nothing without execution. Here are the actual worksheets that make this system work:
Daily Time Allocation Sheet:
``
Date:   Crew:
Jobs Completed:

[Job 1]
Client:  Service Type:
Travel Start:  Arrival:
Work Start:  Work End:
Supply Run: Start  Return
Depart:  Next Destination:

[Repeat for each job]

End of Day:
Last Job Departure: _
Shop Arrival: _
Equipment Maintenance: _ minutes
Notes: __
``
Monthly Service Line P&L Template:
``
Service Line:
Period: _

Revenue: $_
Direct Labor: $_
Allocated Travel Labor: $_
Indirect Labor Share: $_
Materials: $_
Disposal & Fees: $_
Equipment Hours Cost: $_
Overhead Allocation: $_

Gross Profit: $_
Gross Margin: _%

Hours Breakdown:
Direct Service: _
Travel: _
Indirect: _
Total: _

Revenue per Hour: $_
Cost per Hour: $__
``
Overhead Allocation Rules:
Facility Overhead: Allocate by equipment storage nights. Count how many nights each piece of equipment (assigned to service lines) sits in your yard.
Administrative Overhead: Weight by transaction complexity:
-
Simple mowing
1x
-
Maintenance contracts
2x
-
Installation projects
4x
-
Design/build projects
6x
Equipment Overhead: Track actual hours via equipment logs. No equipment log? Use crew hours as proxy but discount by 20% for hand-tool time.
Marketing Costs: Allocate by lead source tracking. Mowing leads from Google Ads? Mowing carries that cost. Referrals? Split based on revenue mix.
Common Allocation Mistakes and Fixes
Mistake: Forgetting to allocate return travel from the last job. Fix: Make "return time" a required field on daily logs. Can't close the day without it.
Mistake: Spreading overhead evenly across all service hours. Fix: Weight by complexity and resource consumption. Installation uses more overhead per hour than mowing.
Mistake: Treating all labor as equal cost. Fix: Use actual hourly rates including burden. A $25/hour installation specialist costs $34 with taxes and benefits. A $16/hour mower operator runs about $21 fully loaded.
Mistake: Ignoring seasonal allocation adjustments. Fix: Calculate annual overhead, then allocate based on full-year service mix, not monthly snapshots.
Mistake: Missing indirect support time. Fix: Track everything. That hour discussing the Johnson project? Allocate it. The 30 minutes fixing the mower? Allocate it.
Mistake: Using revenue as the only allocation base. Fix: Match allocation method to cost behavior. Equipment costs follow equipment hours, not revenue dollars.
Software Automation for Profitability Tracking
Manual tracking works up to a point—usually around 5 crews or 300 jobs per month. After that, the data entry burden overwhelms the office. Numbers lag by weeks. Decisions go back to gut feel.
This is where AI-powered operational software makes a real difference. Modern platforms automatically capture time data from mobile apps, eliminating daily sheets. GPS tracking allocates travel time without manual logs. Integration with accounting systems assigns costs in real-time rather than at month-end.
The bigger improvement is pattern recognition. Automated systems can flag when specific services consistently underperform, catching pricing or efficiency issues before they do real damage to cash flow. They surface seasonal trends you'd miss in spreadsheets—like how fall cleanup margins tend to compress every November due to overtime and equipment strain.
Automated dashboards replace the monthly reconciliation marathon. You see margin trends daily, not monthly. Service line profitability updates after every completed job. Triggers fire when metrics drift outside acceptable ranges, not three weeks after the fact.
The best platforms also handle complex allocation logic automatically—tracking equipment usage through connected hour meters, weighting overhead distribution based on actual resource consumption, and flagging when pricing may need adjustment based on margin targets.
For growing landscaping companies, this kind of automation prevents a common trap: operational complexity outpacing your administrative capacity. You maintain real visibility even as you scale from 30 to 300 jobs per month.
Making Service Line Decisions with Confidence
Real profitability data changes how you run the company. You stop guessing which services to promote. You know what to price for target margins. You can prove why dropping a troublesome service actually improves the bottom line.
Take a common scenario: You've been debating whether to keep offering aeration services. Revenue looks decent at around $18,000 per season. Traditional P&L shows 38% gross margin. Seems worth keeping.
But time-allocated profitability tells a different story. Aeration requires specialized equipment that sits idle 11 months per year. Travel time averages 40% of service time because jobs spread across your entire service area. When you allocate the real costs—equipment overhead, excessive travel, seasonal labor premiums—the true margin drops to 19%.
Meanwhile, your weekly mowing service shows 41% margins after all allocations. It uses equipment efficiently, routes cluster naturally, and overhead burden stays low due to volume. The data makes the decision obvious: focus on mowing, minimize aeration.
-
Push high-margin maintenance contracts over one-off cleanups
-
Limit installation work to periods with crew availability
-
Charge travel premiums for outlying properties
-
Bundle services that share equipment and routing
The discipline of accurate cost tracking also reveals operational problems you might otherwise miss. Maybe installation margins lag because of excessive supply runs. Maybe tree work profits suffer from inefficient disposal routing. The data points you toward specific fixes, not vague productivity mandates.
Building Your Implementation Timeline
Switching to true service line profitability tracking takes about 90 days to fully implement. Here's a realistic breakdown:
Month 1: Design and test your tracking system. Create time logs. Define allocation rules. Train crew leaders on time tracking. Run parallel with existing systems.
Month 2: Refine and adjust. Fix the problems that surfaced in Month 1. Streamline data collection. Build your first real allocated P&L. Compare to historical assumptions—this is usually where things get uncomfortable.
Month 3: Operationalize and automate. Lock in processes. Build dashboards. Set trigger thresholds. Start making decisions based on new data. Consider software automation if the manual process is showing strain.
The hardest part is maintaining discipline during the learning curve. Crews resist detailed time tracking at first. Office staff will question allocation methods. You'll doubt whether the effort is worth it. It is. The difference between guessing and knowing profitability is the difference between hoping for growth and actually engineering it. Companies that understand true service line margins price more confidently, make better resource decisions, and scale more predictably.
Start with basic time tracking next Monday. Build your allocation rules by month-end. By spring, you'll wonder how you operated without it.
Your P&L should tell you more than whether you made money last month. It should show you exactly how to make more next month.
Ready to grow your landscaping business?
Join 2,000+ landscaping pros using Yardyly to save time, reduce task chaos, and deliver outstanding client results.