
Most landscaping companies track everything and act on nothing. Revenue, expenses, job counts, customer satisfaction scores — pages of data that sit untouched while the business runs on gut instinct and whatever crisis popped up this morning.
The problem isn't tracking too few metrics. It's tracking metrics disconnected from actual decisions. You check gross margin every month, but what exactly are you supposed to do when it drops 3%? You count completed jobs, but at what number should you hire another crew? You measure route efficiency, but when do you actually restructure territories?
Successful landscaping companies don't track more KPIs — they track decision-triggering KPIs. Every metric connects directly to a specific action: hire someone, adjust pricing, reorganize routes, expand service areas, or cut unprofitable services.
The Decision-First Framework
Traditional KPI dashboards show you what happened. Decision-mapped KPIs tell you what to do next.
Take crew utilization. Most companies calculate it, stick it on a report, and move on. But what's the actual decision point? At 85% utilization, you're running efficiently. At 92%, your crews are stretched thin and quality starts slipping. At 95%, you're one sick day away from disaster. The metric only matters when it crosses thresholds that trigger specific actions.
The framework works like this: identify your three to five most critical recurring decisions — typically hiring, pricing adjustments, and route optimization. Then you work backwards to find the metrics that signal when those decisions need attention. Not metrics that are "nice to know" or "important for the business." Metrics that make you pick up the phone and do something specific.
A landscaping company in Phoenix tracked everything for years. Customer acquisition cost, lifetime value, equipment depreciation schedules, detailed job profitability analysis. The owner spent hours each month reviewing reports. When I asked what decisions came from all this analysis, silence. They hired based on feeling overwhelmed, raised prices when competitors did, and adjusted routes when drivers complained.
We stripped their tracking down to four decision triggers. When gross margin per crew hour dropped below $47, they reviewed and adjusted service pricing. When weekly overtime hours exceeded 8 per crew for three consecutive weeks, they hired. When drive time exceeded 23% of productive hours, they reorganized routes. When customer churn hit 4% monthly, they audited service quality. Four numbers, four decisions, implemented within 48 hours of crossing thresholds.
Hiring Triggers That Actually Work
Traditional hiring in landscaping is purely reactive. You hire when everyone's burned out, customers are complaining about delays, and you're turning down profitable work. By then, you've lost money, damaged relationships, and exhausted your team.
Never miss a job detail again.
Yardyly helps you plan, confirm, and manage every landscaping project seamlessly.
- Centralized project scheduling
- Automated client updates
- Crew and resource management
No credit card required
Capacity utilization is the wrong metric for hiring decisions. A crew at 90% capacity might sound efficient, but it leaves no buffer for equipment breakdowns, weather delays, or seasonal demand spikes. The real hiring trigger combines three forward-looking indicators.
First, track pending quote value — total dollar amount of outstanding quotes at any given time. When this exceeds 2.5 times your weekly capacity for three consecutive weeks, you're consistently selling more than you can deliver. That's a hiring signal.
Second, measure schedule compression — the percentage of jobs pushed to the next available slot rather than the customer's preferred timing. When more than 30% of new jobs can't be scheduled within the customer's ideal window, you're losing premium pricing power and customer satisfaction.
Third, monitor crew overtime trends on a rolling three-week average. Occasional overtime is normal. When overtime hours exceed 15% of regular hours consistently, you're not managing seasonal peaks — you're understaffed. The cost of overtime plus the hidden costs of fatigue, mistakes, and turnover far exceed proper staffing costs.
A mid-sized operation in Atlanta ignored these signals for months. Their crews averaged 50-hour weeks through spring, thinking they were maximizing profit. By mid-summer, two key employees quit, quality problems led to $8,000 in free re-service calls, and they had to subcontract work at terrible margins just to keep commitments. The "savings" from not hiring cost them close to $40,000.
Pricing Signals Hidden in Your Operations
Most landscaping companies adjust pricing once a year, if that. They benchmark against competitors, add a percentage for inflation, and hope for the best. Meanwhile, their actual cost structure shifts monthly based on fuel prices, labor availability, and equipment maintenance cycles.
The most valuable pricing signal isn't your competitor's rate sheet — it's the relationship between quoted price and close rate by service type. When your close rate for lawn maintenance drops below 25%, you're probably overpriced. When it exceeds 70%, you're leaving money on the table. But this varies dramatically by service.
Design-build projects might close at 20% and still be properly priced because customers shop more carefully for large investments. Weekly maintenance should close at 40-50% if positioned correctly. One-time cleanups can run 60-70% close rates and still maintain healthy margins because customers value speed and availability over price.
Track margin by service type, by crew, and by customer segment. When maintenance margins drop below 45%, but installation margins hold at 60%, you don't need across-the-board price increases. You need selective adjustments.
Route density affects pricing more than most companies realize. Two identical properties might have vastly different profitability based on location. When you're already servicing three properties on a street, the fourth is almost pure margin. When you're driving 20 minutes each way for a single stop, you're probably losing money even at premium prices.
Here's a concrete example: A company with 200 maintenance accounts discovered their Tuesday route averaged $78 per man-hour while their Thursday route only generated $51.
| Route | Average per man-hour |
|---|---|
| Tuesday | $78 |
| Thursday | $51 |
Same crews, same equipment, same service standards. The difference? Tuesday's route had 12 stops within a 3-mile radius. Thursday's route covered 35 miles for 14 stops. They didn't need to raise all prices — they needed to either reorganize routes or implement location-based pricing.
Route Optimization Triggers
Route efficiency in landscaping isn't about finding the shortest path between stops. It's about maximizing billable hours while minimizing drive time, considering traffic patterns, equipment needs, and crew capabilities.
The primary route optimization trigger is productive time percentage — billable hours divided by total crew hours. When this drops below 75% for any route, you're burning money on windshield time. But the solution isn't always tighter routing. Sometimes it's dropping unprofitable outlier accounts, sometimes it's route swapping between crews, sometimes it's scheduling changes to avoid traffic.
Daily revenue per mile driven is more actionable than pure efficiency. Two routes might both achieve 80% productive time, but if one generates $12 per mile driven and another generates $7, you have a pricing problem disguised as a routing problem. This often reveals underpriced customers in far-flung locations that seemed profitable when viewed in isolation.
Service grouping impacts profitability more than proximity. A route that requires crew members to load and unload different equipment sets multiple times kills efficiency. Track equipment changeovers per day. When crews make more than two major equipment switches (mowers to hedge trimmers to aerators), you're losing 30-45 minutes of productive time.
Weather response capability should factor into route design but rarely does. Which routes can absorb a rain delay without cascading failures? Which customers have flexibility in service windows? Building weather resilience into routes means tracking schedule flexibility rates — the percentage of stops that can shift by 24-48 hours without customer complaint.
A 300-account maintenance company had routes organized purely by geography, with each crew covering a specific zone. Made sense on paper. In practice, their "efficient" routes required constant equipment juggling, had no weather flexibility, and mixed time-sensitive commercial properties with flexible residential accounts.
After restructuring based on service type and flexibility rather than pure geography, drive time actually increased by 11%. But productive hours jumped by 20%, overtime dropped by half, and they could absorb weather delays without working weekends. The metrics that mattered improved even though traditional efficiency metrics got worse.
Building Your 15-Minute Weekly Dashboard
The biggest mistake in dashboard design is including everything that might be interesting. Your weekly review should answer three questions: What needs immediate attention? What's trending toward a decision threshold? What worked or didn't work from last week's decisions?
Start with a single-page view that takes 15 minutes to review and act upon. Not 15 minutes to review then another hour to investigate and decide. 15 minutes total, including any immediate actions.
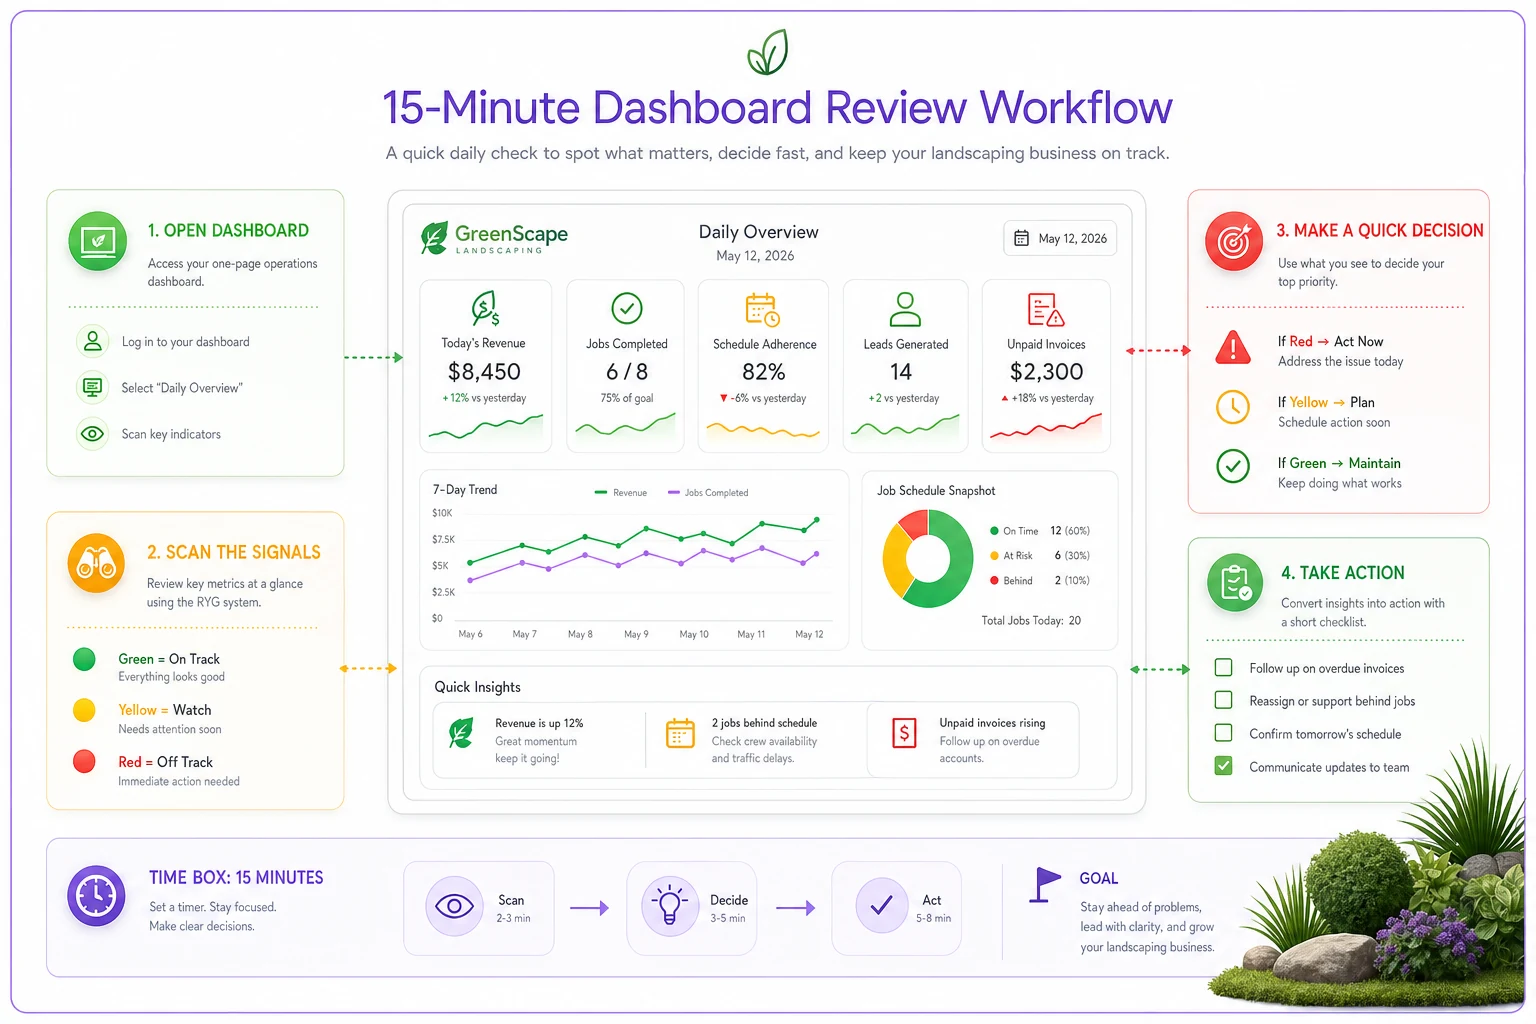
A quick visual workflow you can follow every Monday to scan indicators, check trends, and record actions.
Red/Yellow/Green Status Indicators (2 minutes to scan):
-
Hiring trigger
Weekly overtime average
-
Pricing trigger
Gross margin per crew hour
-
Route trigger
Productive time percentage
-
Quality trigger
Re-service rate
Red means act today. Yellow means monitor closely. Green means system is working.
Trend Lines (5 minutes to interpret):
-
4-week rolling average for each trigger metric
-
Direction and rate of change
-
Distance from threshold
You're looking for movement toward or away from decision points.
Action Items (3 minutes to record):
-
What decisions were triggered?
-
What actions were taken?
-
What should be reviewed next week?
Results from Previous Week (5 minutes to assess):
-
What decisions were made last week?
-
Early indicators of impact?
-
Any adjustments needed?
A dashboard without thresholds is just decoration. Every metric needs specific numbers that trigger specific actions. When overtime average exceeds 8 hours per crew per week: post job opening and start interviewing. When productive time drops below 75%: schedule route optimization session for Saturday morning. When gross margin per crew hour falls below $52: review pricing for bottom 20% of accounts.
One owner in Colorado spent months perfecting a 47-metric dashboard with beautiful charts and automated data feeds. Used it twice. We replaced it with a simple spreadsheet showing four numbers with clear thresholds. He's used it every single Monday for eighteen months, making dozens of proactive decisions instead of reactive scrambles.
Set thresholds that account for seasonality so your dashboard doesn't trigger hiring or pricing changes based on predictable seasonal swings.
Keep the layout consistent week-to-week so trends jump out and actions are quick.
The Communication Layer Most Companies Miss
Metrics trigger decisions, but decisions require communication. The failure point isn't usually identifying when to act — it's getting everyone aligned on what the action means.
When your hiring trigger fires, who needs to know? Just you? Your office manager who handles HR? Your crew leaders who need to plan for training? Your scheduler who needs to account for a training period with reduced capacity? The metric might tell you to hire, but without a communication protocol, the decision stalls.
Create simple communication templates for each triggered decision. When overtime exceeds threshold: "Team, we're consistently exceeding sustainable work levels. Starting the hiring process today for one additional crew member. Expected start date in 3 weeks. Please identify training opportunities in your current schedule."
Price adjustments need even more careful communication. Customers need 30-60 days notice. Sales teams need new rate sheets. Crews need to understand why prices changed so they can handle customer questions. A pricing trigger without a communication plan leads to confused customers and inconsistent implementation.
Route changes affect everyone — customers whose service days change, crews whose territories shift, the office team managing the transition. One company triggered a route optimization, spent a weekend perfectly redesigning territories, then lost two major accounts because no one told customers their service day was changing.
When This Framework Breaks
This decision-mapped approach works brilliantly for established landscaping companies with 3-15 crews. Below that size, you don't have enough data for meaningful thresholds. Above that size, you need more sophisticated analysis and probably dedicated operations management.
Seasonal businesses need adjusted thresholds by time of year. Your hiring triggers in March look different than October. Your route efficiency in peak season versus winter maintenance requires different targets. Build seasonality into your thresholds or you'll make terrible December decisions based on July metrics.
Highly specialized services might need different KPIs entirely. If you're primarily design-build, tracking weekly overtime might be meaningless. If you're purely commercial maintenance with long-term contracts, close rate matters less than renewal rate. Adapt the framework to your actual decision patterns.
The framework also assumes you'll actually make decisions when triggers fire. If you need consensus from six people before hiring, or you're locked into annual price increases only, or your routes are determined by HOA contracts you can't change, then tracking decision triggers is pointless. Track what you can actually control.
Building Your Version
Start by listing every significant decision you made in the past 90 days. Categorize them: hiring, pricing, routing, service changes, equipment purchases, marketing adjustments. Focus on decisions that recur — you'll face the same choice again within the year.
For your top 3-5 recurring decisions, work backwards. What information would have made that decision obvious two weeks earlier? Not perfect, just obvious enough to act. That's your KPI.
Set initial thresholds based on history or best guess. When you hit a threshold, document what you did and what happened. Adjust thresholds based on results, not theory. The overtime threshold that works for a company with young single crews might destroy a company with family-oriented employees.
Review weekly, adjust monthly, overhaul annually. Your business changes, your KPIs should too. The metrics that matter for a company growing 30% annually differ from one optimizing for profit in a mature market.
Most importantly, keep it simple enough to actually use. A perfect framework reviewed never beats a decent framework reviewed weekly. The discipline of regular review and action matters more than picking the perfect metrics.
The difference between landscaping companies that scale successfully and those that hit a ceiling usually isn't strategy or market position. It's the ability to make consistent operational decisions based on clear signals rather than crisis or gut instinct. When every key metric links to a specific decision, when thresholds are clear, and when the weekly review takes 15 minutes not 2 hours, you've built a system that runs the business rather than the business running you.
Your dashboard doesn't need to be fancy. Your metrics don't need to be complex. But the link between measurement and decision must be crystal clear, the thresholds must trigger action, and the review cadence must be sustainable. Get those three elements right and you'll make better decisions faster with less stress and more confidence.
Stop tracking everything. Start triggering decisions.
Ready to grow your landscaping business?
Join 2,000+ landscaping pros using Yardyly to save time, reduce task chaos, and deliver outstanding client results.