



Most landscaping owners don't have a profitability problem. They have a commitment problem. The season fills up, the trucks roll, and by August you realize the mulch promo you ran in March ate your best crews for six weeks while your highest-margin install work sat in the backlog. Nobody decided that on purpose. It just happened because the booking calendar filled before anyone modeled what those bookings would actually cost in crew hours, equipment, and opportunity.
Service line capacity modeling for landscaping is the practice of connecting three things that usually live in separate heads: what you're booking, who you have to do it, and what each of those service families actually earns per crew-hour. When those three stay disconnected, you grow revenue and shrink margin at the same time — which is the single most common way a busy landscaping company goes broke slowly.
This article is about building the scenario templates that let you pressure-test a season, a promo, or a new service on paper before it hits the field. Not a forecast of what you hope happens. A model of what breaks when it does.
Why bookings, crew mix, and margin drift apart
A company sells across four or five service families — mowing/maintenance, cleanups, mulch and bed work, installs and hardscape, irrigation. Each one has a wildly different margin profile and a wildly different crew requirement. But the sales side treats them as interchangeable revenue. A $4,000 hardscape job and $4,000 of mowing visits look identical on a revenue report and completely different on a crew calendar.
What breaks is capacity math. Mowing is high-frequency, low-margin-per-visit, but it's predictable and it pays for your fixed overhead week after week. Installs are lumpy, high-ticket, and they need your most skilled two or three people — the same people who, if pulled onto a big patio job, leave your maintenance routes short.
When you book without modeling the crew-mix trade-off, you don't see the conflict until the week it lands. The real cost isn't the install. It's the maintenance accounts that got skipped, the overtime you paid to catch up, and the renewal conversation in October that goes sideways because the client's lawn looked rough in July.
This usually happens when sales targets are set in dollars and capacity is tracked in gut feel. The two never reconcile until the P&L does it for you at year-end.
The core model: revenue per crew-hour by service family
Before any scenario template is useful, you need one clean number for each service family: contribution margin per productive crew-hour. Not per job. Not per dollar of revenue. Per hour of the specific crew that does the work.
Never miss a job detail again.
Yardyly helps you plan, confirm, and manage every landscaping project seamlessly.
- Centralized project scheduling
- Automated client updates
- Crew and resource management
No credit card required
That number is what makes two jobs comparable. A $900 mulch job that takes a 3-person crew five hours (15 crew-hours) and a $900 maintenance route that takes a 2-person crew four hours (8 crew-hours) are not the same business. One earns roughly $40/crew-hour in contribution, the other closer to $85 — assuming similar material loads. You cannot see that difference on a revenue dashboard. You can only see it when you allocate real time.
If you haven't built the underlying time-allocated numbers yet, that's the prerequisite work. The breakdown on a time-allocated P&L system with dashboard triggers walks through how to get honest cost-per-hour by line before you try to model scenarios on top of it. Scenario modeling built on bad per-hour numbers just produces confident garbage.
| Service family | Avg ticket | Crew type | Crew-hrs/job | Contribution/crew-hr | Seasonal demand |
|---|---|---|---|---|---|
| Maintenance (mow) | $55–$85 | 2-person | 0.6–1.2 | $75–$95 | Steady Apr–Oct |
| Spring/fall cleanup | $350–$900 | 3-person | 6–14 | $45–$60 | Sharp spikes |
| Mulch & beds | $600–$1,400 | 3-person | 8–18 | $35–$55 | Apr–Jun peak |
| Install / hardscape | $4k–$25k | 3–4 skilled | 40–180 | $55–$80 | Weather-driven |
| Irrigation | $1,500–$6k | 2 specialized | 10–30 | $60–$90 | Open/close surges |
The ranges matter more than the midpoints. Notice that cleanups — a classic "fill the schedule" service — often have the lowest contribution per crew-hour of anything on the board, yet they consume your 3-person crews during the exact weeks installs want to start. That single conflict is where most spring margin quietly leaks.
The three scenario templates worth building
You don't need twenty models. You need three, and each one answers a different "what if" that burns landscaping companies every year.
1. The promo template
Promos feel free because the demand response is visible and the capacity cost is invisible. A "20% off spring mulch, book by March 31" offer looks great when the phone rings. The template's job is to force the uncomfortable question: what does fulfilling this promo displace?
-
Expected uptake (conservative, likely, aggressive)
-
Discounted contribution/crew-hour for the promo service
-
Crew-hours the promo will consume in the peak weeks
-
The contribution/crew-hour of whatever work gets pushed out
The number that matters isn't promo revenue. It's net contribution change after displacement. A mulch promo that books 60 extra jobs at a discounted $38/crew/hour, while bumping 400 crew-hours of install work worth $65/crew-hour into a worse weather window, can be net-negative even though revenue went up and the crews stayed busy. Busy and profitable are not synonyms, and the promo template is where that stops being an abstraction.
2. The seasonal spike template
Spring cleanup and irrigation open-ups don't arrive evenly — they arrive in a three-week wall. The spike template models the peak-week crew-hour demand against your actual peak-week crew-hour supply, including realistic availability (not headcount × 40, which no crew ever actually delivers).
A typical example: a company has 5 crews, nominally around 1,600 crew-hours available in a peak two-week window. Cleanup backlog plus committed maintenance plus a couple of early installs demands roughly 1,950 crew-hours. That 350-hour gap is the model's output, and it's a decision, not a surprise. You close it by adding a float crew, shifting maintenance frequency, pushing install starts, or declining late cleanup bookings — but you decide in February, not during the wall.
This connects directly to how you set buffers and escalation paths. If you want the operational side of absorbing these spikes, the approach in decision-driven scheduling with capacity buffers and escalation paths pairs with the model — the template tells you the gap size, the scheduling system tells you how to react when it hits.
3. The new-service template
New services are where optimism does the most damage. Owners model the revenue (big) and forget the ramp cost (bigger than expected) and the crew-mix drain (the real killer). A new-service template should assume:
-
Lower productivity for the first 8–12 weeks (crews are learning)
-
Skilled-crew borrowing from existing profitable lines
-
Equipment utilization below breakeven early on
-
A gate that must be cleared before scaling
The honest version of this model usually shows the new service losing money for a full season even when it "works." That's fine — if you've decided the strategic bet is worth it. It's not fine when it's a surprise that shows up as a mysterious margin drop across your existing lines because your best people spent April figuring out the new thing.
The crew-mix impact calculator
This is the piece almost nobody builds, and it's the one that connects everything. A crew-mix calculator takes a proposed set of bookings and tells you whether your actual crew composition can deliver it profitably — not just whether the total hours fit.
The logic runs like this:
-
Break each booked service family into its required crew type (2-person maintenance, 3-person general, skilled install, irrigation specialist).
-
Sum required hours by crew type for the target week or month.
-
Compare against available hours by type, not in aggregate.
-
Flag any crew type that's over 90% utilized — that's your constraint.
-
Calculate the blended contribution/crew-hour of the proposed mix.
-
Test one or two reallocations and watch the blended number move.
The insight that comes out of this calculator is almost always the same: your bottleneck is a specific crew type, not total capacity. You might have "plenty of hours" on paper while your two skilled install leads are at 110% and your general crews are at 70%. Total utilization looks healthy. Reality is on fire. The calculator makes the mismatch visible before the schedule does.
Worth naming a smaller pattern here too: companies tend to over-hire general labor (cheap, easy to find) and under-invest in the skilled constraint role, because headcount feels like capacity. It isn't. Adding your sixth general crew member does nothing if hardscape throughput is gated by one experienced lead. The calculator keeps hiring decisions pointed at the actual bottleneck.
Gating rules: testing offers before they launch
A model is only useful if it has teeth. Gating rules are the pass/fail thresholds a scenario has to clear before you commit. Without them, modeling becomes a report you admire and then ignore.
Reasonable gates for most small-to-mid landscaping operations:
-
Blended contribution/crew-hour of the scenario stays above your fixed-cost coverage line (the hourly rate you need just to break even on overhead).
-
No single crew type exceeds ~90% utilization in any peak week under the "likely" uptake case.
-
Net contribution after displacement is positive — a promo can't quietly fund itself with your best work's margin.
-
A new service clears its 90-day ramp gate (defined breakeven productivity) before you schedule phase-two marketing.
-
You have a named fallback lever (float crew, frequency shift, decline list) if the aggressive-uptake case lands.
Cap promo slots and model the crew-mix conflict in February so you can reserve install-capable crew-hours before the wall hits.
If a scenario fails a gate, you don't necessarily kill it — you adjust it. Shrink the promo window. Cap the number of promo slots. Delay the new-service launch by a quarter. The gate turns "let's try it and see" into "let's try it within these limits so a surprise can't wreck the season."
When this makes sense — and when it doesn't
Full scenario modeling is worth the effort once you're running roughly three or more crews across three or more service families. Below that, the conflicts are small enough to hold in your head, and a lightweight spike check is plenty.
It's a bad idea to model everything if you don't yet trust your per-hour cost numbers. Garbage inputs produce confident, specific, wrong answers — and those are more dangerous than no model at all, because people act on them. Fix the time-allocated P&L first.
Who should not run promo displacement math: a company with a chronically empty calendar. If you have idle crews, displacement isn't your problem — demand is. Model that one later, once the schedule is actually competing for the same hours.
A real scenario: the "profitable" spring that wasn't
A three-crew operation running maintenance, cleanups, mulch, and small installs came off a spring that felt like their best ever. Revenue was up, phones rang constantly, every crew was slammed. Then the year-end close landed and net margin was down versus the prior season.
When they rebuilt it as a capacity model, the cause was obvious in about an hour. An "early-bird cleanup" promo had packed March and April with cleanup work at roughly $48/crew-hour. That work ran their two 3-person crews flat out — the same crews that handled installs at closer to $70/crew-hour. Six install jobs got pushed into a rainy late-May window, two cancelled, and the crews racked up around 90 hours of overtime catching up on maintenance that slipped during the cleanup wall.
The promo "worked" — it booked out the spring. It also displaced roughly $18k–$22k of higher-margin install contribution and added real overtime cost, for maybe $9k of discounted cleanup revenue. Net, the great spring cost them a noticeable chunk of margin.
The fix the following year wasn't dramatic. They capped promo cleanup slots, modeled the crew-mix conflict in February, and protected install-capable crew-hours as a reserved block. Revenue grew a little less. Margin recovered and then some. The entire difference came from deciding the trade-off on purpose instead of discovering it in December.
Where this connects to the rest of the business
Capacity modeling isn't a standalone spreadsheet exercise — it's the layer that ties your sales targets to your hiring plan to your cash. The output of a good scenario model is an input to your workforce and cash planning: the crew-hour gaps you surface in February are the hiring and float-crew decisions you make before the season, and the margin picture feeds directly into cashflow timing.
If you're building the planning side out, the 12-month workbook linking bookings to hiring and CapEx is the natural home for these scenario outputs. The capacity model answers "can we deliver this mix profitably?"; the workbook answers "can we afford the crews and equipment to do it, and when does the cash land?" Run them together and the whole season stops being a series of reactions.
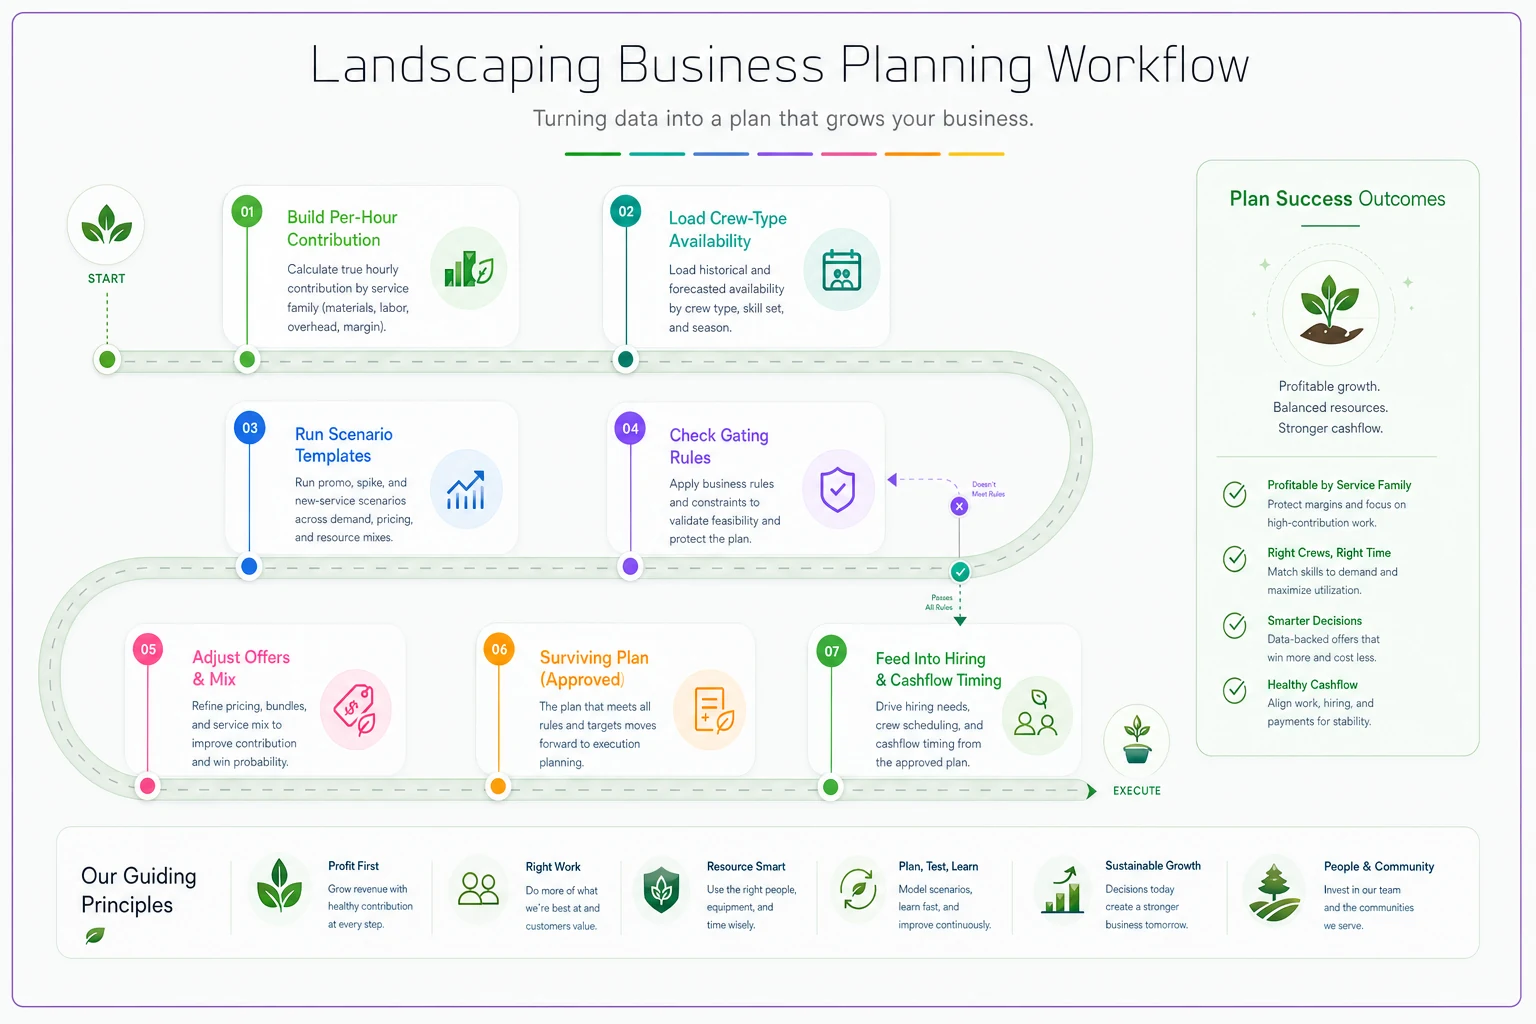
The practical workflow looks like this: build honest per-hour contribution by service family → load the base crew-type availability → run the promo, spike, and new-service templates against it → check each against your gates → adjust the offers until they pass → feed the surviving plan into hiring, float-crew, and cash timing. None of it requires fancy tooling. It requires that bookings, crew mix, and margin finally sit in the same model instead of three different minds.
Visual: a simple workflow image can make the decision flow obvious at a glance.
The companies that stay profitable while growing aren't the ones with the most bookings. They're the ones who know, before the season starts, exactly which bookings they shouldn't take.
The companies that stay profitable while growing aren't the ones with the most bookings. They're the ones who know, before the season starts, exactly which bookings they shouldn't take.
Ready to grow your landscaping business?
Join 2,000+ landscaping pros using Yardyly to save time, reduce task chaos, and deliver outstanding client results.