



Most landscaping owners already know their business breathes. Spring floods you with work, summer stretches your crews thin, fall slows down, and winter either dries up or shifts to leaf cleanup, snow, or nothing at all. That part isn't the problem.
The problem is that the booking surge, the hiring decision, the payroll pressure, and the equipment purchase all live in separate heads and separate spreadsheets. By the time you feel the cash squeeze, you've already made the hiring and buying decisions that caused it. A 12‑month cashflow workbook fixes the sequencing — it forces booking velocity to drive hiring triggers, and it makes payroll and CapEx line up against the months that actually generate revenue instead of the months you happen to be staring at the bank balance.
This isn't about building a fancy financial model. It's about one connected view where the number of signed jobs this week tells you whether to hire, whether to go temp or permanent, how much payroll pressure is coming, and whether you can actually afford that mini‑excavator you've been eyeing.
Why the standard approach quietly bankrupts good operators
The pattern that shows up constantly in seasonal trades: owners react to the calendar, not the pipeline.
A typical example looks like this. March rolls in, the phone starts ringing, and the owner hires three crew members because "it's spring, we always need people in spring." Fair enough. Except the actual bookings didn't materialize until mid‑April that year because of a wet, cold stretch. So for about five weeks, there are three extra guys on payroll — roughly $9k–$11k in labor — charged against jobs that haven't been sold yet. The business eats that straight off the top.
Then the flip side happens in July. Bookings are through the roof, crews are maxed, the owner is turning down work — but nobody hires because July feels like "we're already busy, we'll get through it." So you leave money on the table during your highest‑velocity month and pay for idle labor during your slowest ramp.
The root issue is that hiring is triggered by season instead of signed work. Season is a bad proxy. Booking velocity — how fast new jobs are landing and how deep the backlog runs — is the real signal. When you build the workbook around velocity, the hiring decision stops being a gut call tied to whatever month it is.
The spine of the workbook: booking velocity as the trigger
Before anything else, you need a clean weekly number for booking velocity. Not revenue. Not estimates sent. Signed, scheduled work — measured in crew‑hours or crew‑days of committed labor.
Never miss a job detail again.
Yardyly helps you plan, confirm, and manage every landscaping project seamlessly.
- Centralized project scheduling
- Automated client updates
- Crew and resource management
No credit card required
The reason crew‑hours beat dollars here is simple: dollars hide capacity. A $12k install and a $12k month of mowing contracts consume wildly different labor. If you forecast hiring off revenue, you'll routinely over‑ or under‑staff. Committed crew‑hours tell you exactly how many bodies the backlog actually requires.
Once you have that, the workbook tracks three things week over week:
-
Committed crew‑hours already on the schedule for the next 2–4 weeks
-
New crew‑hours booked this week (the velocity number)
-
Available crew‑hours based on current headcount
The gap between committed and available is your hiring signal. If committed hours are running 115%–130% of available capacity for two or three consecutive weeks and new bookings are still climbing, that's a real trigger — not a hunch. If committed hours sit under 80% of capacity while new bookings flatten, that's your signal to freeze hiring or lean on temp release.
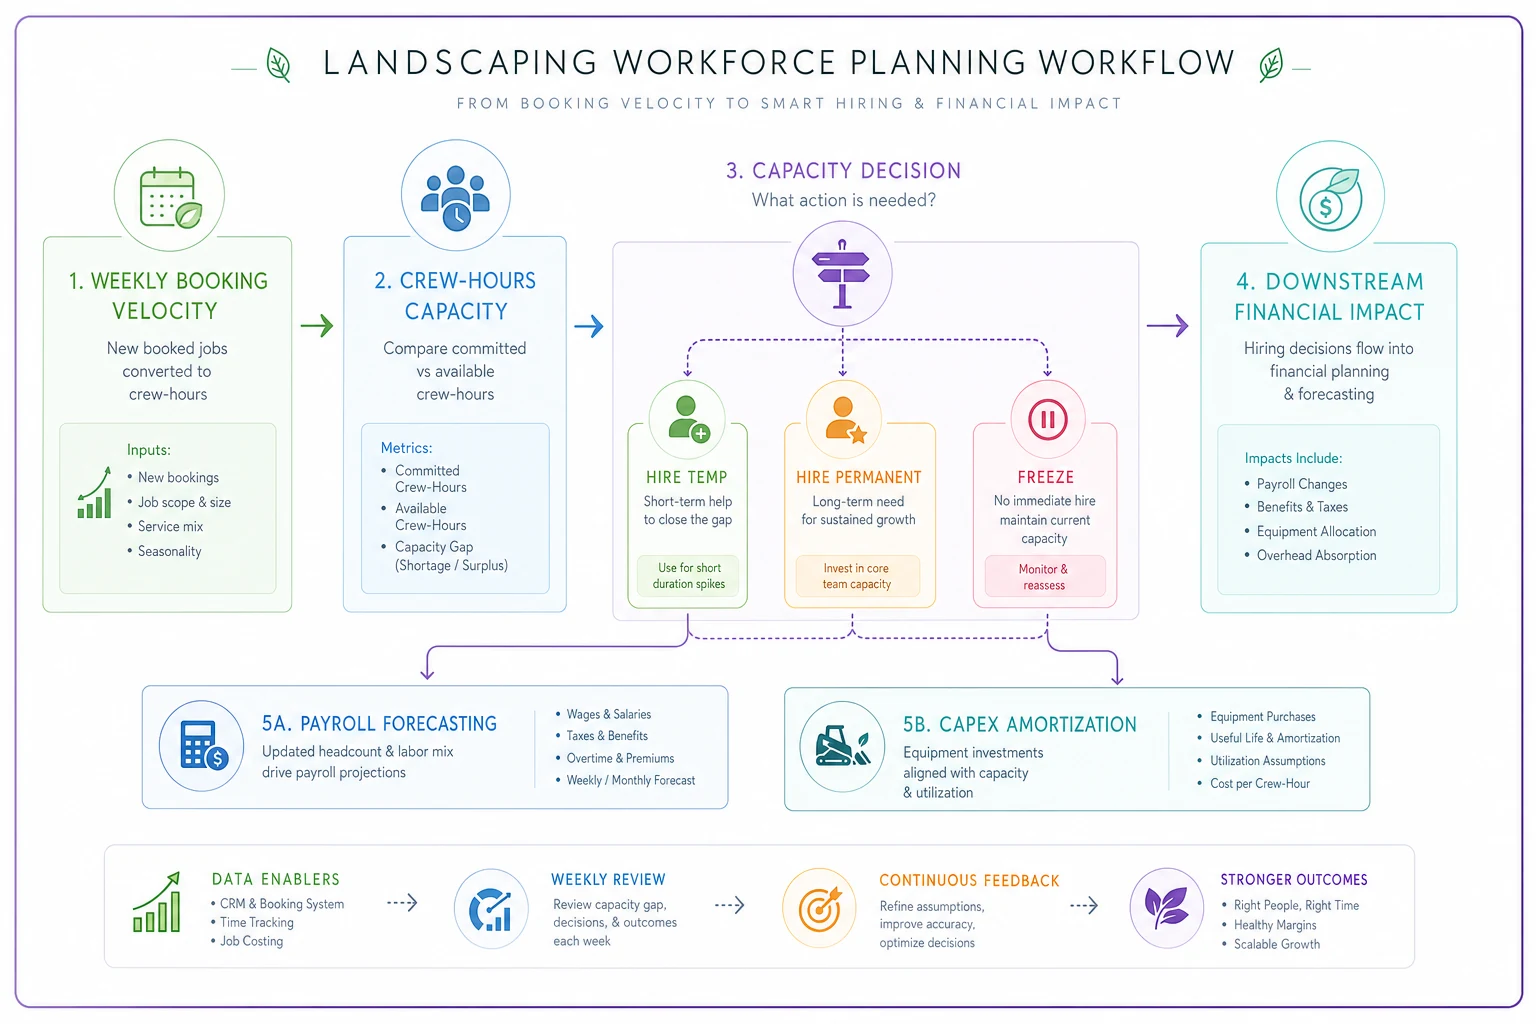
This kind of trigger logic works best when it's tied into the metrics you're already watching. It's worth connecting to the broader framework in Decision‑Mapped KPIs for Landscaping so hiring doesn't live in its own disconnected spreadsheet.
Temp vs permanent: the decision most owners get backwards
This is where the money leaks are quiet but large. The instinct is to hire permanent when you're panicking and temp when you're cautious. In practice it should usually be the reverse.
The question isn't "do I need help." It's "is this demand structural or is it a spike?" Structural demand — recurring maintenance contracts, a commercial account you just won, year‑over‑year growth visible in the booking trend — justifies permanent hires. Spike demand — a burst of one‑off installs in April and May that collapses by June — is exactly what temp labor and subcontractors exist for.
A simple way to frame the call:
| Signal | Lean Permanent | Lean Temp / Sub |
|---|---|---|
| Demand type | Recurring / contracted | One‑off / project burst |
| Booking trend | Rising across multiple months | Spike confined to 1–2 months |
| Backlog depth | 3+ weeks sustained | Short, front‑loaded |
| Skill needed | Crew lead, equipment operator | General labor, cleanup |
| Cost tolerance | Lower hourly, higher commitment | Higher hourly, zero off‑season carry |
The math that trips people up: a permanent crew member might cost somewhere around $22–$26/hr loaded during the season, but you're also carrying that person through shoulder months when billable hours drop. A temp at $30–$34/hr looks more expensive per hour, but if you only need them for a 7–8 week install surge, the total cost is often lower and you carry zero winter liability.
Where owners lose real money is defaulting to permanent for a spike. Hiring two full‑timers in April for an install rush, then dragging them through a slow fall at reduced utilization, can quietly run an extra $8k–$14k per head versus running that same surge on temp labor. The workbook makes this visible because it shows you the demand shape across twelve months, not just the current crunch.
Payroll smoothing: surviving the months revenue doesn't cover payroll
Even with the right mix, seasonal payroll is lumpy. The classic trap is that your two biggest payroll months — usually peak summer — land before a chunk of that work gets invoiced and collected. You're funding July's labor out of June's collections, which were generated by May's lighter schedule. The timing mismatch is what kills otherwise profitable companies.
Payroll smoothing in the workbook means projecting labor cost and collections on the same timeline, offset by your actual collection lag. If you invoice net‑15 but customers really pay in 30–40 days, your workbook needs to model cash landing 4–6 weeks after the work happens. When you overlay projected payroll against projected cash‑in, the dangerous months jump out immediately.
A few smoothing levers that actually work:
-
Build a labor reserve during peak. Set aside a fixed percentage of peak‑month collections — even 5%–8% — specifically earmarked for shoulder‑season payroll. Boring, effective.
-
Front‑load deposits on spring installs. Collecting 30%–50% up front on install work pulls cash forward into the exact months your payroll spikes.
-
Stagger permanent start dates against the velocity ramp, not the calendar. Starting a new hire two weeks after bookings cross your trigger, rather than two weeks before, saves real idle payroll.
-
Use temp release as a cash valve. The ability to scale labor down in slow weeks without severance or layoffs is itself a cashflow tool.
Consistently collect 30%–50% deposits on installs to pull cash forward into payroll months.
The insight most owners miss: payroll smoothing isn't about spending less on labor. It's about matching when you pay labor to when the cash from that labor actually arrives. Two companies with identical annual labor costs can have completely different survival odds based purely on timing.
CapEx amortization against seasonal demand
Equipment decisions get made at the worst possible time — usually in the heat of peak season when a machine dies or feels undersized, which is exactly when cash is already tight and judgment is clouded by the daily grind.
The workbook's job is to pull CapEx out of the panic window. Every major purchase should be amortized across the productive months that piece of equipment actually earns, not spread evenly across all twelve. A stump grinder that only runs during a fall removal push shouldn't be budgeted as if it earns in February. When you amortize against productive months, you get an honest cost‑per‑billable‑hour — and that number tells you whether to buy, rent, or sub the work out.
A realistic framing: a used skid steer at roughly $38k–$45k that you'll run maybe 22–26 weeks a year carries a very different real cost than the sticker suggests. Spread across only the weeks it earns, plus fuel, maintenance, and financing cost, the hourly burden might land somewhere that makes short‑season rental the smarter call — unless your booking forecast shows enough committed hours to justify owning. That's the whole point: the CapEx decision should fall out of the booking forecast, not out of a tired afternoon in July.
For the lifecycle side of this — when to replace versus repair, and how to see those costs coming — it's worth pairing this workbook with the thresholds in Reduce Downtime and CapEx Surprises, so your 12‑month cash view already has the big equipment hits baked in rather than getting ambushed mid‑season.
When buying actually makes sense
-
Committed crew‑hours show the equipment earning across 20+ weeks
-
You're paying rental fees that exceed amortized ownership cost within 2–3 seasons
-
The work is recurring and contracted, not speculative
When it's a bad idea
-
The need is driven by a single large job you haven't closed yet
-
Your shoulder‑season cash reserve can't absorb a bad month after the purchase
-
You're buying to solve a scheduling problem that's really a hiring or routing problem
For the lifecycle side of this — when to replace versus repair, and how to see those costs coming — it's worth pairing this workbook with the thresholds in Reduce Downtime and CapEx Surprises, so your 12‑month cash view already has the big equipment hits baked in rather than getting ambushed mid‑season.
A short real scenario
A two‑crew maintenance‑and‑install operation — somewhere in the $540k–$600k annual revenue range — kept running into the same wall every year. Peak summer felt profitable, but by October the account was scraping bottom and the owner was borrowing against a line of credit to cover payroll into November.
When they rebuilt the year around booking velocity instead of the calendar, two things changed. First, they stopped making both spring hires permanent. One stayed permanent against the growing maintenance contracts; the other became a seasonal temp slot covering the install spike. That single change cut roughly $10k off the annual labor carry. Second, they moved to 40% deposits on installs over $4k, which pulled cash forward into the exact payroll‑heavy months.
The slow‑season scramble didn't vanish entirely, but the October line‑of‑credit draw dropped by more than half, and the owner went into winter with an actual labor reserve for the first time. Nothing fancy happened. The decisions just got made in the right order.
Where software quietly earns its keep
None of this requires a platform. You can run the whole thing in a spreadsheet if you're disciplined about updating booking velocity every week. The honest difficulty is the updating — a static workbook decays the moment bookings shift, and most owners stop maintaining it somewhere around June.
Where an AI‑assisted operational platform helps is keeping the inputs live without manual re‑entry. When your scheduled jobs, committed crew‑hours, invoicing, and collections already flow through one system, the workbook stops being something you maintain and becomes a view that updates on its own. Booking velocity gets calculated from actual signed work, the hiring trigger flags when committed hours cross your threshold, and your payroll‑versus‑collections timeline reflects reality instead of a guess from three weeks ago. The decision logic is still yours — the software just removes the data‑wrangling that causes most owners to abandon the forecast halfway through the season.
Bringing it together
The reason seasonal cashflow wrecks so many otherwise strong landscaping businesses isn't bad margins or lazy crews. It's decisions made in isolation and in the wrong sequence — hiring off the calendar, buying equipment in a panic, and discovering the payroll squeeze only after it's already happening.
A 12‑month workbook that ties booking velocity to hiring triggers, forces an honest temp‑versus‑permanent call, smooths payroll against real collection timing, and amortizes CapEx against the months equipment actually earns gives you something most seasonal operators never have: the ability to see the squeeze coming while you can still do something about it. Start with one clean weekly number — committed crew‑hours — and let every other decision hang off it.
The reason seasonal cashflow wrecks so many otherwise strong landscaping businesses isn't bad margins or lazy crews. It's decisions made in isolation and in the wrong sequence — hiring off the calendar, buying equipment in a panic, and discovering the payroll squeeze only after it's already happening.
A 12‑month workbook that ties booking velocity to hiring triggers, forces an honest temp‑versus‑permanent call, smooths payroll against real collection timing, and amortizes CapEx against the months equipment actually earns gives you something most seasonal operators never have: the ability to see the squeeze coming while you can still do something about it. Start with one clean weekly number — committed crew‑hours — and let every other decision hang off it.
Ready to grow your landscaping business?
Join 2,000+ landscaping pros using Yardyly to save time, reduce task chaos, and deliver outstanding client results.