



Walk into most multi-crew landscaping operations and ask three people what "gross margin" means on the maintenance side. The office manager pulls it from accounting software. The ops lead calculates it from crew hours. The owner has a gut number from last quarter. All three are different — sometimes by 8–10 points — and everyone thinks they're right.
That's not a spreadsheet problem. That's a definition problem. And it's the quiet reason so many landscaping dashboards get ignored after the first month. When people don't trust the number, they stop looking at it. Then you're back to running the company on feel.
Why two crews looking at the "same" number end up arguing about reality
A KPI taxonomy is the fix — not in any fancy sense. It's just a written agreement: here's exactly what each metric means, here's the formula, here's who owns the data, here's how often it refreshes, and here's what you actually do when it goes red. Without that, every crew lead, every branch, every dashboard drifts into its own private version of the truth.
This is the piece most owners skip because it feels like admin busywork. But if you've read our take on decision-mapped KPIs that trigger hiring, pricing, and routing, you already know metrics are only useful when they're tied to an action. A taxonomy is what makes those triggers survive contact with a growing team.
The failure pattern: how "one number, many definitions" happens
Nobody sets out to build inconsistent dashboards. It creeps in.
Never miss a job detail again.
Yardyly helps you plan, confirm, and manage every landscaping project seamlessly.
- Centralized project scheduling
- Automated client updates
- Crew and resource management
No credit card required
You start with one crew and one owner doing the books. Every number lives in your head, so consistency isn't an issue. Then you add a second crew and hire someone part-time to handle invoicing. Now there are two people touching data, and they each make small, reasonable choices. Does drive time count as billable hours? Does a partial reschedule count as a cancellation? Does the deposit count as revenue when it's collected or when the job closes?
Each answer feels obvious to the person making it. The problem is they're making different obvious choices.
By the time you're running four or five crews, the drift is baked in. Sales reports a close rate that doesn't match what ops sees in the schedule. The maintenance P&L looks healthy on one report and thin on another. And when you sit down to make a real decision — add a crew, raise prices, drop a service line — you can't, because you don't know which number to believe.
The argument is never really about the data. It's about the rules nobody wrote down. Fix the rules and most of the arguing disappears.
What a real KPI definition actually contains
A KPI on a dashboard is a name and a number. A KPI in a taxonomy is a small contract with six parts:
-
Canonical name — one name, used everywhere. Not "close rate" in sales and "win %" in ops.
-
Plain-language definition — what it measures and why anyone should care.
-
Exact formula — including edge cases (what counts, what's excluded).
-
Data owner — the single person responsible for the inputs being correct.
-
Refresh cadence — daily, weekly, monthly. When it updates and when people should look.
-
Red / yellow / green thresholds + owner action — what "bad" looks like and what to do about it.
That last part is where most taxonomies fall apart. People define the metric carefully and then leave the "so what" blank. A red flag with no assigned action is just anxiety on a screen.
The core landscaping KPI set, defined properly
You don't need forty metrics. Eight to twelve that actually drive decisions is plenty. Here's a starter taxonomy for the metrics that matter most in a maintenance-plus-install shop.
| KPI (canonical name) | Formula | Data owner | Refresh | Green / Yellow / Red |
|---|---|---|---|---|
| Billable Hour Ratio | Billable field hours ÷ total paid field hours | Ops lead | Weekly | ≥78% / 70–77% / <70% |
| Maintenance Gross Margin | (Maintenance revenue − direct labor − direct materials) ÷ revenue | Bookkeeper | Monthly | ≥55% / 45–54% / <45% |
| Estimate Close Rate | Signed jobs ÷ estimates delivered (30-day window) | Sales owner | Weekly | ≥40% / 30–39% / <30% |
| Schedule Adherence | Jobs completed as scheduled ÷ jobs scheduled | Dispatcher | Daily | ≥92% / 85–91% / <85% |
| Revenue per Crew Day | Completed revenue ÷ crew-days worked | Ops lead | Weekly | ≥$1,800 / $1,400–1,799 / <$1,400 |
| Rework Rate | Callback/redo visits ÷ total completed jobs | QA lead | Weekly | ≤3% / 4–6% / >6% |
| AR Over 30 Days | AR balance >30 days ÷ total AR | Bookkeeper | Weekly | ≤10% / 11–20% / >20% |
| Crew Turnover (rolling 90) | Departures ÷ average headcount | Owner/HR | Monthly | ≤10% / 11–18% / >18% |
The thresholds above are starting points, not gospel. A high-end install shop and a volume mow-and-go operation will land in different places. What matters is that your team agrees on them once and stops re-litigating them every Monday.
Two worked examples, because formulas lie until you run them
Billable Hour Ratio. Say a two-person crew is paid for 80 hours in a week (40 each). They spent 12 combined hours on drive time, 4 hours on shop loading and unloading, 3 hours idle waiting on a gate code and a rained-out morning. That's 19 non-billable hours. Billable = 61. Ratio = 61 ÷ 80 = 76%. That's yellow. Not a crisis, but it's telling you drive time and access delays are eating roughly a full day a week across the crew.
The trap: some shops count shop time as billable because "it's work." Fine — but then everyone has to count it that way, or your ratio means nothing across crews. The formula matters less than the consistency.
Estimate Close Rate. Sales delivered 22 estimates in a 30-day window and signed 7. Close rate = 7 ÷ 22 = 32%, yellow. But here's the edge case that wrecks this metric: what about the 5 estimates still "open" that were sent 3 days ago? If you count them as losses, you're punishing recent activity. That's why the 30-day window exists — an estimate isn't counted until it's had a fair chance to close. Write that rule down or your close rate will swing wildly every week for no real reason.
Data owners: the part everyone underthinks
Every KPI needs exactly one owner. Not a committee. One name.
The data owner isn't the person who looks at the number — that's usually the owner or ops lead. The data owner is the person responsible for the inputs being clean. If Revenue per Crew Day is garbage because crews aren't logging completed jobs on time, that's a data ownership failure, and you need to know whose job it was to fix it.
When a metric has two owners, it effectively has zero. Both assume the other is checking. The AR Over 30 report looks fine for six weeks, and then you discover $14k in invoices nobody ever sent because "I thought Sarah handled the commercial accounts." Assign one name, put it in writing, and make it part of that person's role — the same way you'd standardize any core process in your prioritized SOP playbook.
Refresh cadence: match the number to the decision
The mistake here is updating everything daily because it feels rigorous. It isn't rigor — it's noise. Daily gross margin will bounce around from material timing and payroll cycles, and you'll make bad calls chasing swings that mean nothing.
A simple rule: refresh a metric on the same cadence as the decision it drives.
-
Daily — schedule adherence, jobs completed, same-day disruptions. These need a fast reaction.
-
Weekly — billable ratio, close rate, revenue per crew day, rework, AR aging. These drive coaching and short-term adjustments.
-
Monthly — gross margin by service line, turnover, capex-related metrics. These drive structural decisions.
The weekly numbers are where most of the real management happens. That's also why they belong in your recurring management rhythm rather than a report nobody opens — tying them into a structured weekly ops huddle is what turns a dashboard into actual decisions.
Owner action templates: the whole point of red/yellow/green
Colors don't fix anything. Actions do. Every threshold in your taxonomy should have a pre-written response so that when a number goes red, nobody has to invent a plan under pressure.
Most operations I've seen skip this entirely. They build a clean dashboard, assign colors, and then when something turns red everyone looks at each other. Having the action already written — before things go wrong — removes that hesitation.
Billable Hour Ratio — RED (<70%)
-
Owner action
Ops lead pulls the previous week's route sheets within 48 hours.
-
Diagnose
Is it drive time, access delays, weather idle, or crew pace?
-
If drive time >15% of paid hours → route clustering review.
-
If access delays are recurring → property-record gate/access fields updated before next visit.
-
Report the root cause and one corrective action at the next weekly huddle.
Rework Rate — YELLOW (4–6%)
-
Owner action
QA lead tags every callback by cause (missed spot, quality, communication, plant issue).
-
If one crew accounts for >50% of callbacks → coaching conversation before their next scheduled work.
-
If one service type dominates → review the scope and spec for that service.
AR Over 30 Days — RED (>20%)
-
Owner action
Bookkeeper produces an aged list by client within 24 hours.
-
Any invoice >45 days → owner-level call, not another email.
-
Freeze new work for accounts >60 days until a payment plan is signed.
-
Flag whether the root cause is late invoicing (internal) or a slow-paying client (external) — the fixes are completely different.
Every template names an owner, a timeline, a diagnostic step, and a decision. That's what separates a taxonomy from a wall of numbers.
A short checklist to build your own taxonomy
A short checklist to build your own taxonomy
-
- [ ] List every metric currently on any dashboard or report across the company
-
- [ ] For each, write down every different definition people are actually using
-
- [ ] Pick one canonical name and one formula per metric — settle the edge cases explicitly
-
- [ ] Cut the list to 8–12 metrics that actually drive decisions
-
- [ ] Assign exactly one data owner per metric
-
- [ ] Set a refresh cadence that matches the decision, not your anxiety
-
- [ ] Write red/yellow/green thresholds calibrated to your business
-
- [ ] Write an owner action template for every red and yellow state
-
- [ ] Store it in one place everyone can see — not five spreadsheets
-
- [ ] Review the thresholds quarterly, not weekly
That last point matters. Thresholds should be stable enough that people trust them, but reviewed occasionally so they don't go stale as the business changes.
A real scenario: the four-crew shop that couldn't trust its own reports
A residential maintenance and install operation — four crews, somewhere around $1.4M a year — had three different "close rate" numbers floating around. Sales reported close to 45%. The owner's gut said maybe 35%. The scheduling data implied something lower.
The reason turned out to be embarrassingly simple: sales counted a job as "closed" when the client verbally agreed. Ops counted it when a deposit hit. Anything that fell through in between — and a fair number did — vanished from the sales version but not from ops.
They spent an afternoon writing one definition: an estimate is closed when a signed agreement and deposit are both received, measured on a 30-day window. Same rule for every dashboard. Once that stuck, the real number landed around 33%. Uncomfortable, but honest.
The interesting part wasn't the corrected number. It was what changed downstream. With a trustworthy close rate, the owner finally noticed that install estimates were closing at roughly half the rate of maintenance estimates — which pointed straight at a pricing and follow-up problem on the install side. Within a couple of quarters they'd tightened follow-up and nudged pricing, and install close rate climbed into the high 30s. None of that was visible while three definitions were quietly arguing with each other.
When a full taxonomy is worth it — and when it isn't
When it makes sense: You're running two or more crews, more than one person touches your data, and you're starting to make real decisions — hiring, pricing, dropping service lines — off reports. That's exactly when definition drift starts costing you money.
When it's overkill: You're a solo operator or a single crew with the owner doing all the books. You don't need a formal taxonomy yet — you are the taxonomy. Writing it down now is fine, but don't let it become a project that pulls you off the truck.
Who should not do this halfway: Anyone about to add a second location. Definition drift across locations is brutal to unwind later. Lock the taxonomy before the second location opens, not after.
Where the software fits — quietly
You can run a taxonomy on a shared spreadsheet, and plenty of solid operators do exactly that for years. The friction shows up in the inputs: crews forgetting to log completed jobs, deposits recorded inconsistently, someone hand-copying numbers between reports and introducing errors. That's when the cracks start showing, not in the definitions themselves, but in whether anyone's actually following them.
Here's a simple visual of the workflow that software should support.
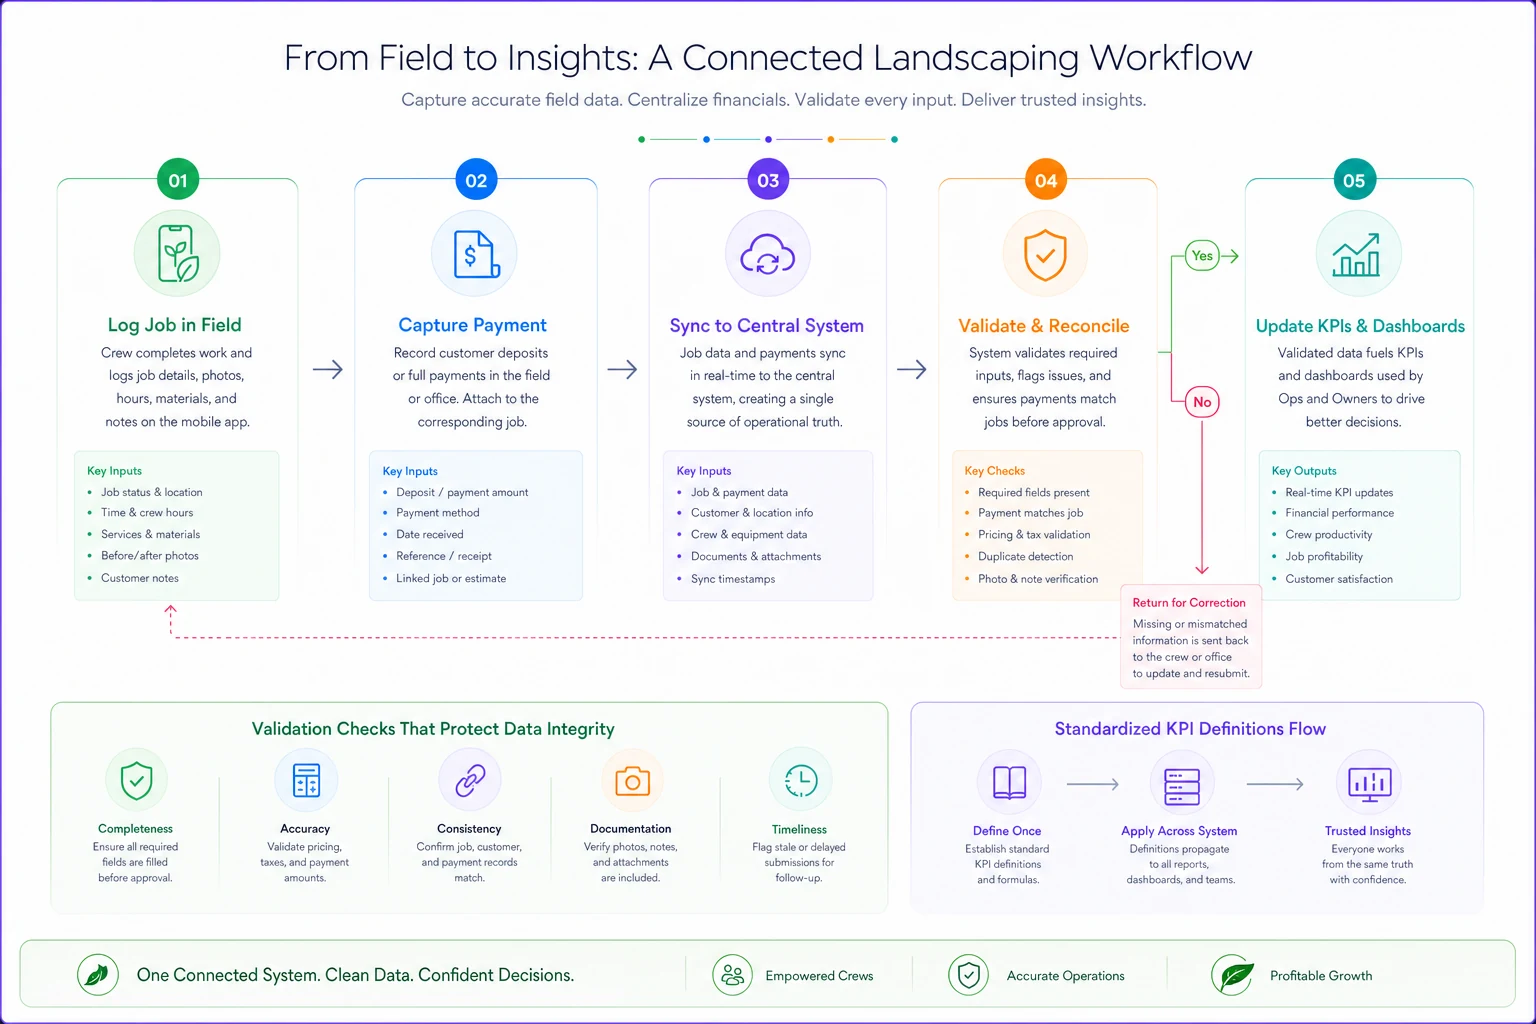
The taxonomy is the agreement. The software is what keeps everyone honest to it without a human policing every entry.
Inconsistent dashboards aren't a sign that your team is careless. They're a sign that the rules were never written down, so everyone filled in the blanks differently. A KPI taxonomy is just the act of writing those rules once — the name, the formula, the owner, the cadence, and the action — so that a red flag means the same thing to every person who sees it.
Do that, and the arguments about which number is right mostly go away. What's left is the harder, more useful conversation: what are we going to do about the number now that we all trust it.
Ready to grow your landscaping business?
Join 2,000+ landscaping pros using Yardyly to save time, reduce task chaos, and deliver outstanding client results.