



Most landscaping owners look at their P&L the way you'd glance at a weather app on the way out the door — quick check, mostly to confirm what you already assumed. Revenue looks fine, payroll looks about right, close the tab, back to bidding. That habit is exactly why so many operations run a decent top line and still wonder where the cash went by November.
The problem isn't that owners don't read their P&L. It's that the P&L your accountant hands you is organized for taxes, not for operations. It'll tell you "Disposal Expense" was $6,300 last month. It won't tell you that $1,900 of that came from one crew making unscheduled dump runs because they kept overfilling the trailer. That gap — between what the number is and what the number means — is where reconciliation actually lives.
What follows is a month‑end close built specifically for landscaping, tied to real data you already have: bank feed, invoices, payment processor, fuel and disposal receipts. Twelve steps, each with a red‑flag threshold so you're not just staring at numbers wondering if they're bad. The goal is a close you can finish in an evening and actually act on.
Why P&L Reconciliation for Landscapers Is Different
A generic small‑business close reconciles the bank, matches invoices, and calls it a day. Fine for a business where costs are stable. Landscaping isn't that.
Your costs move with the route. Fuel burns faster in July than October. Disposal fees spike during spring cleanups and fall leaf season. Subcontractor bills show up two weeks late and rarely match the estimate. Vehicle repairs hit in unpredictable clumps. If you reconcile these as flat line items, you flatten out exactly the signal you need — which crew, which route, which truck is bleeding.
The reconciliation that actually works ties each dollar back to the job or route that created it. When disposal spikes, you want to know whose job. When fuel jumps, you want to know which route. A P&L that can't answer "which one?" is just a scorecard, not a diagnostic.
The Four Cost Centers That Actually Matter
Before the steps, get clear on where landscaping margin leaks. Four categories cause the overwhelming majority of "where did it go" surprises:
Never miss a job detail again.
Yardyly helps you plan, confirm, and manage every landscaping project seamlessly.
- Centralized project scheduling
- Automated client updates
- Crew and resource management
No credit card required
| Cost center | Typical share of costs | Why it drifts | What it hides |
|---|---|---|---|
| Route / labor utilization | 45–60% | Windshield time, undersold routes | Crews paid for hours that don't bill |
| Disposal / dump fees | 4–10% | Overfilled loads, wrong facility | Extra trips, off‑contract dumping |
| Subcontractor bills | 8–20% (seasonal) | Late invoices, scope creep | Billing above quoted scope |
| Vehicle / equipment | 8–15% | Repairs clump, fuel varies | One bad truck dragging the fleet |
These overlap with your standard P&L categories but don't map cleanly onto them. That's the point. The close below forces each dollar back to a route, a job, or a truck — so the number stops being a mystery.
The 12‑Step Monthly Close
Do these in order. The first few build the foundation; the middle ones are where the red flags live; the last few tie it together so you're actually making a decision, not just reviewing history.
Step 1 — Lock the Bank Feed and Match Every Deposit to a Payment Source
Start by reconciling the bank against your payment processor and invoices. Every deposit should trace to either an invoice payment, a card batch, or a known transfer. The red flag here isn't a missing dollar — it's a deposit you can't explain in under two minutes.
Red‑flag threshold: More than 3 unexplained deposits, or any single deposit over roughly $500 you can't source.
Step 2 — Reconcile Outstanding Invoices Against Payments Received
Pull your open invoice list and compare it to what actually landed. You're looking for the gap between billed and collected. This is where slow‑pay clients hide, and it's where a lot of "we had a good month" turns into a cash crunch two weeks later.
If your invoicing is loose to begin with, this step will be miserable — which is a sign the upstream process needs work. Tightening deposit rules and SLA timelines, which we covered in Invoicing Mistakes That Kill Cash Flow, makes this step take minutes instead of an afternoon.
Red‑flag threshold: Collected/billed below 90% for maintenance work, or any single invoice over 45 days old.
Step 3 — Calculate Billable Route Utilization Per Crew
This is the big one. Take each crew's paid hours for the month and split them into three buckets: billed on‑site hours, drive time, and everything else — loading, breaks, shop time, dead time. Then compute the percentage that's actually billed.
A typical example: a two‑person crew logs around 340 paid hours in a month. If only 210 of those hit an invoice, you're at roughly 62% utilization — and the other 130 hours are coming straight out of your margin. Most owners assume they're running at 80%+ and are genuinely surprised when they do the math.
Red‑flag threshold: Billable utilization under 65% on a maintenance route. Under 65% almost always means the route is undersold, over‑driven, or padded with a slow crew.
Step 4 — Break Out Drive Time as Its Own Line
Windshield time is the most expensive thing landscapers refuse to measure. Pull drive hours out separately and multiply by loaded labor cost. Seeing "we spent close to $2,800 in labor just driving last month" tends to change the routing conversation pretty fast.
Red‑flag threshold: Drive time above 20% of paid hours on any route. Above that, you've got a clustering problem — not a crew problem.
Step 5 — Reconcile Disposal Fees to Specific Jobs
Take every dump and transfer‑station receipt and assign it to a job. Not a category — a job. If you can't tie a $180 dump fee to a cleanup you invoiced, that's a leak. The pattern that shows up constantly: cleanup disposal costs that never made it onto the customer invoice, so the client paid for the labor while you ate the tipping fee.
Red‑flag threshold: More than 15% of disposal receipts that can't be matched to a billed job, or any single dump run over $150 that wasn't passed through.
Step 6 — Count Unscheduled Dump Runs
Separate from the dollar amount, count trips. A crew making three runs to the transfer station in a week when the load should've fit in one is burning fuel, labor, and time. This usually surfaces as a disposal cost problem, but it's actually a training and equipment issue in disguise.
Red‑flag threshold: More than one unplanned disposal trip per crew per week. Above that, look at trailer capacity or how loads are being packed before you blame the bill.
Step 7 — Match Every Subcontractor Invoice to a Quoted Scope
Sub bills are where scope creep hides. Pull each invoice and lay it next to what you agreed to pay. The common failure: the sub quoted $1,200 for an irrigation repair, the bill comes in at $1,650 with a line for "additional labor," and nobody caught it because it got paid on autopilot.
Red‑flag threshold: Any sub invoice more than 10% over quoted scope without a documented change order. If it's over quote and you can't find the approval, hold it until you can.
Step 8 — Check Subcontractor Timing and Cash Impact
Late sub invoices distort your month. A sub who bills 30 days late makes last month look great and this month look rough. Note which bills arrived for prior‑month work and flag the chronic late billers — they make your monthly close unreliable and bury your true job costs.
Red‑flag threshold: More than 20% of sub costs arriving for prior‑period work. Chronic lateness means you need to change payment terms or hold retention going forward.
Step 9 — Reconcile Fuel by Vehicle, Not by Lump Sum
Total fuel spend is almost useless. Fuel per truck is where the story is. Assign every fuel receipt or fleet‑card charge to a specific vehicle, then compare against that truck's typical usage. A truck suddenly burning 25% more fuel is telling you something — a dragging brake, a route change, or personal use.
Red‑flag threshold: Any vehicle's fuel cost jumping more than 20% month‑over‑month without a matching increase in jobs run.
Step 10 — Roll Up Vehicle Repair and Maintenance Per Unit
Pull every repair invoice and assign it to the specific truck or mower. You're building a per‑unit cost history. One truck that's absorbed $2,300 in repairs over two months isn't a maintenance line item — it's a replace‑or‑keep decision that's been sitting in your general expenses without anyone noticing.
This is exactly the data that feeds a real replacement decision. Tying these monthly numbers into the lifecycle thresholds from Reduce Downtime and CapEx Surprises turns a scary repair bill into a planned, budgeted swap instead of a panic purchase.
Red‑flag threshold: Any single vehicle's trailing‑3‑month repair cost exceeding roughly 50% of its monthly payment or 1.5x the fleet average.
Step 11 — Compute Contribution Margin Per Route
Now bring it together. For each route, subtract labor, drive, disposal, fuel, and allocated vehicle cost from the revenue it generated. What's left is what that route actually contributes. Owners are almost always surprised that their "big" route contributes less than a smaller, tighter one a few miles away.
Red‑flag threshold: Any route contributing under 30% margin after all four cost centers. Under 30% and the route needs a price increase, a re‑cluster, or a goodbye.
Step 12 — Write Down Three Decisions Before You Close the File
Reconciliation is worthless if it doesn't produce action. End every close by writing three decisions: one route to re‑price or re‑cluster, one cost leak to plug, one process to fix upstream. Small, specific, committed.
Red‑flag threshold: If you can't name three decisions, you didn't reconcile — you just re‑read your P&L.
A Quick Checklist to Keep the Close Tight
Before you call the month closed, run through this:
-
[ ] Every bank deposit matched to a source
-
[ ] Collected‑to‑billed ratio calculated and above threshold
-
[ ] Utilization computed for each crew
-
[ ] Drive time broken out separately
-
[ ] Disposal receipts matched to jobs
-
[ ] Unscheduled dump runs counted
-
[ ] Sub invoices matched to quoted scope
-
[ ] Late sub bills flagged
-
[ ] Fuel reconciled per vehicle
-
[ ] Repairs rolled up per unit
-
[ ] Contribution margin per route calculated
-
[ ] Three decisions written down
Check all twelve and you'll know exactly where your money went — and more importantly, where it's going next month.
A Real Scenario: The Route That Looked Fine
A three‑crew maintenance operation in the $80k–$90k monthly revenue range was convinced their largest commercial route was their best performer. It billed the most, so it felt like the winner. Made sense on paper.
When they actually reconciled it, the picture flipped. The route sat across town, so drive time was running close to 24% of paid hours. Two of the properties generated heavy green‑waste, and the crew was making an extra transfer‑station run most weeks — disposal on that route alone was around $900 a month, and a chunk of it never made it onto the invoices. After labor, drive, disposal, and fuel, the route's contribution margin came in near 22%.
Their smallest route — tight cluster, low drive time, minimal disposal — was contributing over 40%.
Nothing dramatic happened next. They raised prices on two properties on the big route, dropped one that wouldn't budge, and re‑clustered the remaining stops with a nearby route. Within a couple months the same crew was running tighter days, disposal trips dropped, and the margin climbed into the low 30s. No new customers, no new trucks — just a close that finally told them the truth.
Where This Usually Breaks Down
The close above is simple in theory and brutal in practice for one reason: the data lives in five different places. Fuel is on a card statement, disposal is a shoebox of receipts, invoices are in one system, payroll hours in another, sub bills in email. Reconciling means stitching all of it together by hand every month, and most owners quit somewhere around step 5.
That's the real reason reconciliation gets skipped — not laziness, just friction.
When job, payment, and cost data live in one operational platform instead of scattered across five tools, most of these steps become a filter and a sort instead of an evening of copy‑paste. AI-powered operational software can tag receipts to jobs when costs are entered, tie fuel charges to a specific truck automatically, and surface the contribution‑margin math before you even sit down to review. The close stops being a chore and turns into a short review of exceptions — the kind of work that actually leads somewhere.
You don't need software to run this close. But if you're skipping it because the data's scattered, that's a fixable problem — and fixing it is usually cheaper than one undersold route running loose for a full season.
The Flow of a Monthly Close
Here's the rough sequence of how a proper landscaping close moves, from locking the data to making decisions:
-
Bank feed locked
-
Invoices matched to payments
-
Labor hours bucketed (billed / drive / other)
-
Disposal receipts assigned to jobs
-
Sub invoices matched to quoted scope
-
Fuel + repairs assigned per vehicle
-
Contribution margin computed per route
-
Three decisions written down
The sequence matters. Skipping ahead to margin without cleaning up the receipts and invoices first just means your margin number is wrong. Each step feeds the next.
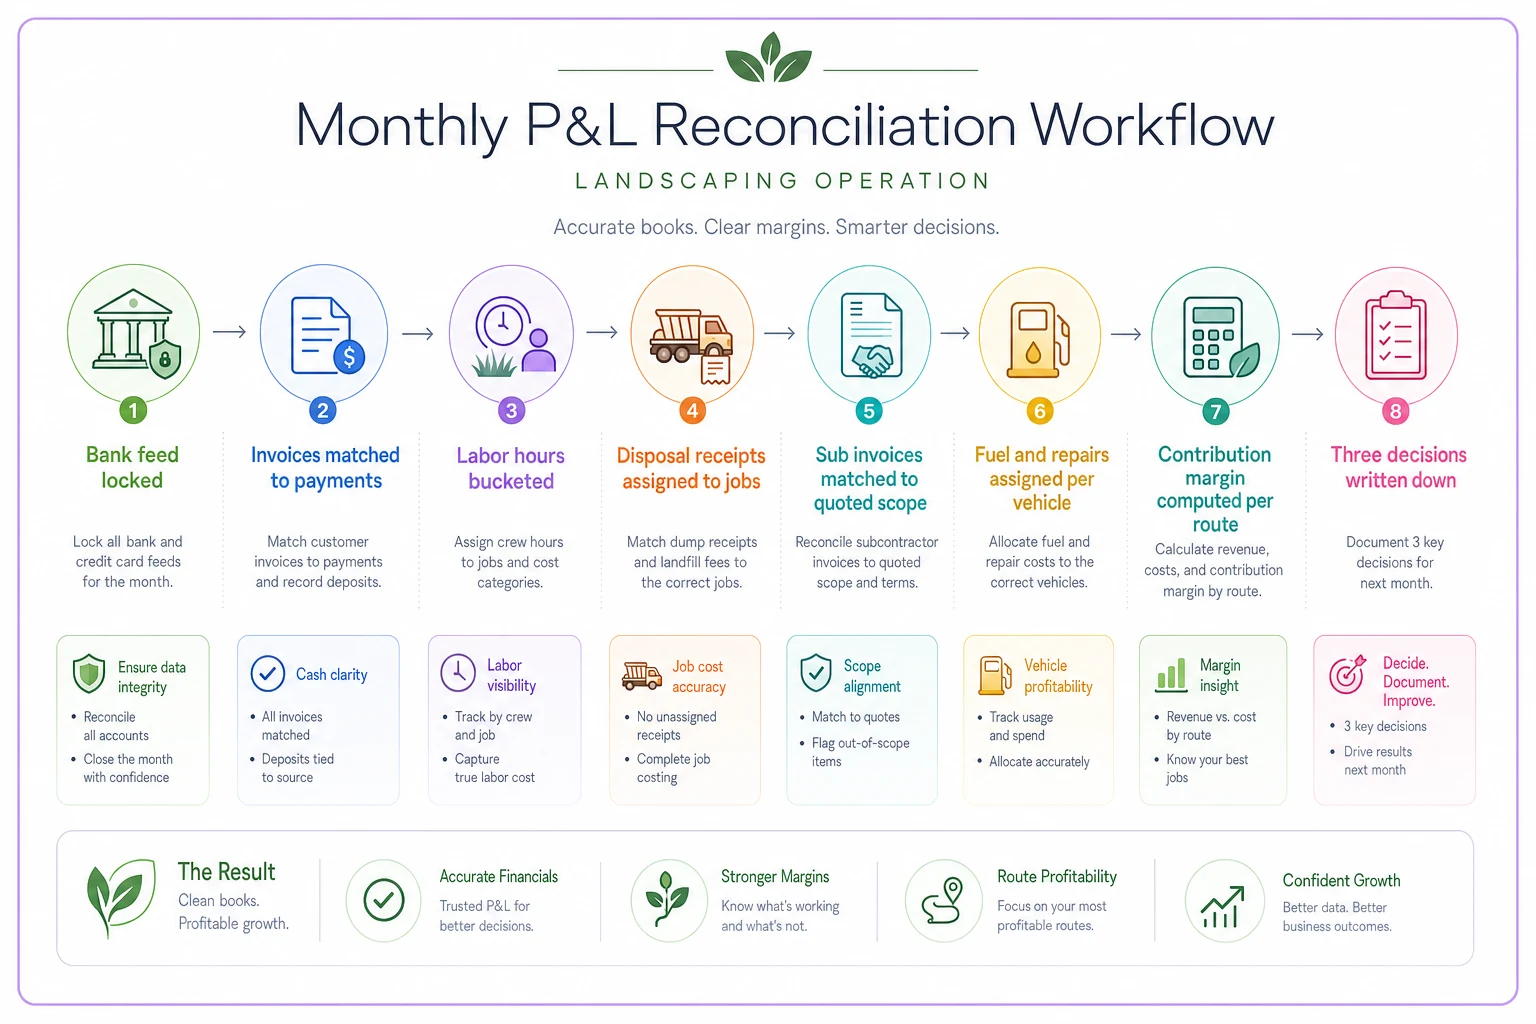
Use this visual as a quick reference for the monthly close flow.
Closing Thought
The owners who stay profitable through a full season aren't the ones with the fanciest reports. They're the ones who know, every month, which route makes money, which truck is becoming a problem, and which sub is padding the bill.
Those aren't answers you get from glancing at a P&L. They come from a close that forces every dollar back to the thing that spent it. Run these twelve steps once, and you'll never look at "Disposal Expense: $6,300" the same way again.
Those aren't answers you get from glancing at a P&L. They come from a close that forces every dollar back to the thing that spent it. Run these twelve steps once, and you'll never look at "Disposal Expense: $6,300" the same way again.
Ready to grow your landscaping business?
Join 2,000+ landscaping pros using Yardyly to save time, reduce task chaos, and deliver outstanding client results.